
What is the demand for student accommodation?
According to The Founder and CEO of Novyy, Ashish Saraff, “In recent years, student accommodation has been referred to as the greatest performing asset in the United Kingdom”.
Tantalisingly though he adds, “Is this the secret to reaping the greatest financial rewards from a property investment, or merely a pipe dream?”

Ashish Saraff then gives a much fuller thesis, saying that “there has been an exponential increase in student desire for the whole university experience since the COVID-19 pandemic. “
With limited student budgets and escalating living costs, it is difficult for students to find housing on campus, forcing them to look for alternatives such as the private rental sector.
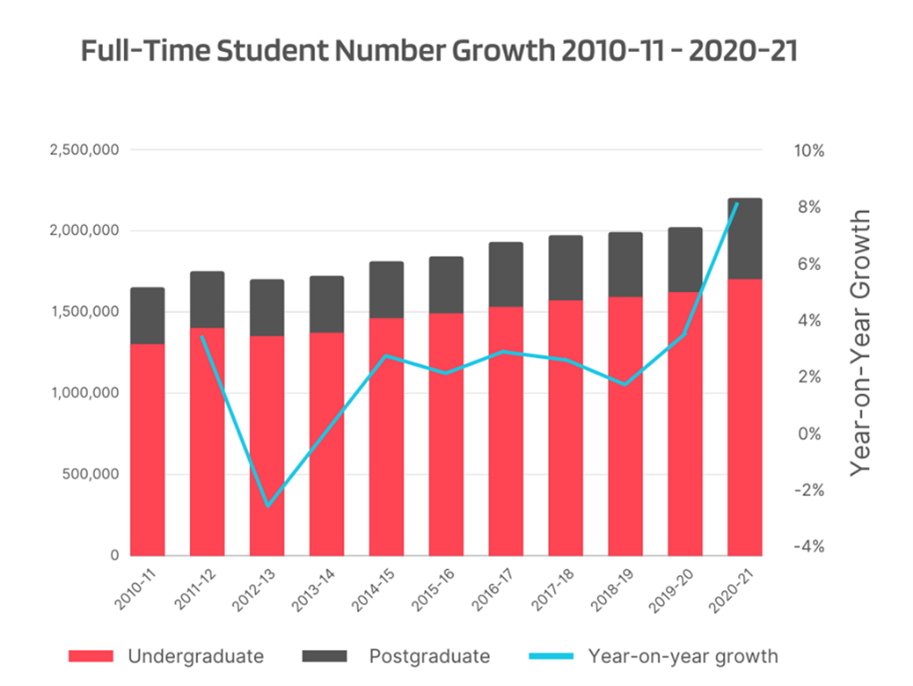
According to Erudera, there are currently 2.86 million active students who live in a form of shared housing.
Over 3 million young professionals between the ages of 21 and 30 live in shared housing across the country. Quite a large market, right? This will only expand year after year as more new students seek accommodation in the summer before beginning their university courses in September.
Young professionals around the country will always be looking for a place to live based on the relocation needs of potential work prospects. Between 2017 and 2022, the rate of international student enrolment increased from 0.45 million to 0.60 million.
International students are an important driver in the private renting sector because they typically have the financial means to live in higher-end HMOs or PBSA. The benefits of PBSAs make them a viable option for international students because they are frequently located in favourable areas and contain meeting rooms, gyms, cinema suites, cafes, and bars. From the perspective of a landlord, having a better product in comparison to competitors who may not have similar amenities gives them an advantage over other landlords.
Student Bed Shortfall?
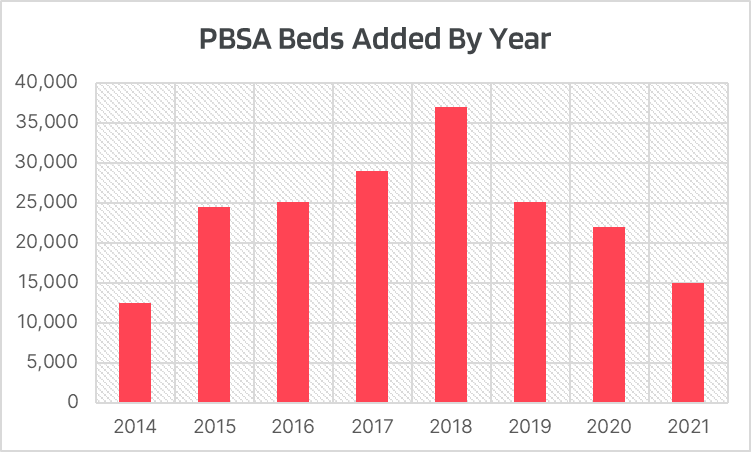
While the student population grows, the number of available beds is expected to be vastly outnumbered by 2025. According to StuRent data, there would be a 450,000 bed shortage by 2025. In comparison to the additional 700,000 students who will need housing, the findings of the StuRent study indicated that only over 248,000 beds will likely be delivered between 2017 and 2025. Since 2017, PBSA rents have increased at a 3.7% annual rate. HMO rentals have grown by an average of 5.1% each year over the same time period.
From the standpoint of a landlord, gaining an HMO or a PBSA is the jackpot in this current economy since it will be much more difficult to achieve in two years when the influx of students continues to increase and competitors acquire the available HMOs or PBSAs on the market.
Why should an investor jump on the opportunity to acquire student accommodation? While the supply and demand balance looks enticing, what generates the profit?
Rental Yields
Student accommodation yield percentages are often higher than ordinary buy-to-let properties. They are typically predicted to be between 8 and 10%, with better endurance in retaining this yield percentage over time. The benefit of an HMO is the type of tenanting. Instead of renting to a group of people under a single tenancy agreement, you can rent it to a single person and potentially double your income. This is the driving force behind rental yields that are much greater than standard buy-to-let yields. The rental yield will improve if each room is rented individually and the property has a shared kitchen, living room and bathroom.
Property Management
Owners of HMO or PBSA properties typically engage a dedicated student accommodation management company to oversee the on-going management of tenants, the maintenance of the property’s rooms and public spaces, and the letting of the property from the sales process through the acquisition of tenants. This may relieve an investor of the time-consuming chores of property management.
Since the investment is considered hands-off, many investors see this luxury as the driving force behind a student housing investment. This type of investing is becoming increasingly popular in the United Kingdom among investors looking to lessen their management responsibilities while enhancing income generating. Would you call this a wise investment strategy? Investing in student housing is the missing piece of the puzzle.
Are student houses a good investment?
If you are an investor or a landlord, investing in student accommodation is a no-brainer. Especially if you manage to acquire a property in an area with two universities or a university ranked in the top 30 in the country. Demand for student housing has been extraordinarily high since the pandemic and will only continue to rise; you can virtually always count on tenants year after year.’
The CEO of Novyy, Ashish Saraff concludes that, ‘Students usually opt for accommodation near the campus or city centre, so keep an eye out for these. Price appreciation is another factor to consider in the future. As the economy of the area in which your house is located improves, so will the property price. As long as you are able to obtain one, student housing is a win-win situation for both investors and landlords. There are numerous opportunities available for you to expand your portfolio!’
About Novvy

Novyy is an investment platform designed to facilitate private market investing for individuals and family offices globally who wish to invest in the British Buy-To-Let market. The platform offers access to curated real estate opportunities with a focus on Co-Living segment via SFRs (Single Family Residences) and HMOs (Houses in Multiple Occupation / Multi Family Residences) by aggregating individual demand through a SPV (Special Purpose Vehicle) / feeder fund structure that invests directly into the underlying target assets.
Every asset is levered with lender finance as well. We also offer secondary market investment, portfolio-level reporting, simplified annual tax reports and proprietary research, thereby enabling individual investors to access private market real estate transactions with lower barriers to entry.
To directly contact the Founder and CEO of Novyy, Ashish Saraff just email a@novyy.com
Bricks&Logic may have utilised advanced statistical techniques to construct the UK’s most accurate and interactive house price heat map
What is the Bricks&Logic heat map and what can it do?
Michael Joyner, Chief Data Scientist at Bricks&Logic, has taken the time to do a really deep dive into a very hot topic, that of the accuracy of data surrounding property assets, and more importantly its interpretation.
He took time out of his busy schedule to tell us how he sees it, Michael began by saying, “Most UK house price heat maps display simple averages of sold properties aggregated at a regional level. However, this approach is heavily limited by the low volume of housing transactions and the diversity of the UK housing stock, which can lead to distorted values and a lack of local nuances.
For instance, house prices in Norfolk may vary significantly from those in Essex, despite both being located in the East of England. At Bricks&Logic, we have created a digital twin of every property in England and Wales (soon to include Scotland) to apply our heat map to all properties, not just those that have sold. This allows us to provide users with a high level of granularity to explore various features of the housing market, such as:
- Average sale, rental and yield values, as well as £/sq ft
- Visualisation of sale and rental value movements over time
- Filtering of the above by unique attributes
- Display of the density of particular types of housing stock
Analysing property performance by type in the same location
Following the pandemic, there was a surge in demand for homes with gardens and home offices, popularly known as the “race for space”. It was commonly believed that demand for these properties in rural areas had increased relative to their urban counterparts. However, little attention was given to how demand for properties in the same location varied based on their attributes. The reason for this was the complex analysis required, until now.
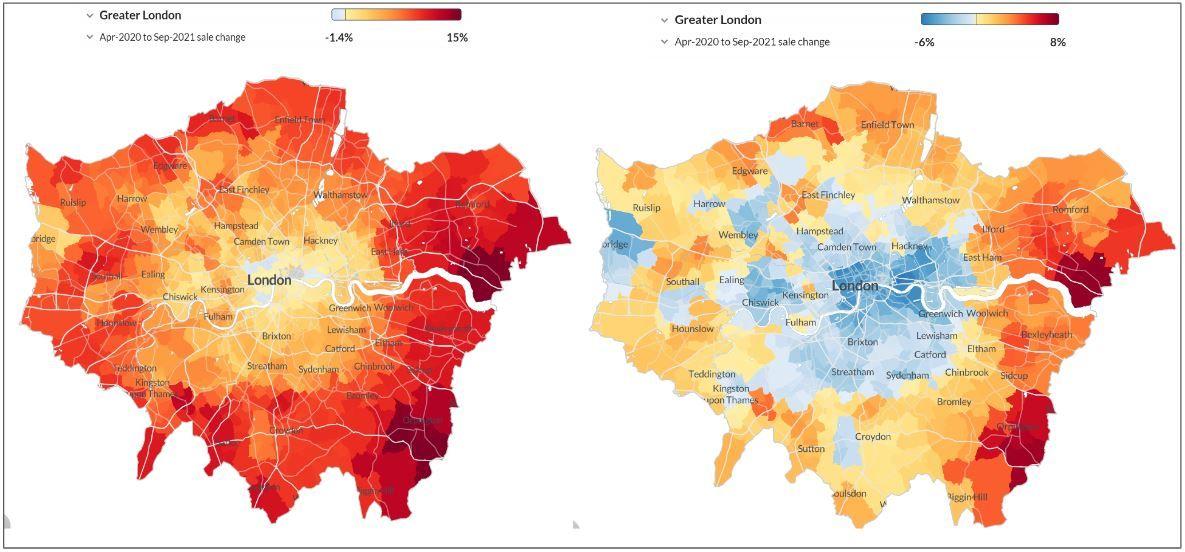
The image below shows the Bricks&Logic heat map displaying sale price changes in Greater London between April 2020 and September 2021. The map on the left shows the performance of houses with gardens, while the right-hand map depicts the equivalent performance of flats with no outdoor space.
It is evident that houses outperformed flats during this period, with houses experiencing nearly universal increases in value across London, while flats in the city centre saw decreases and only experienced slight rises at the periphery.
Adapting the scale to accurately portray house prices
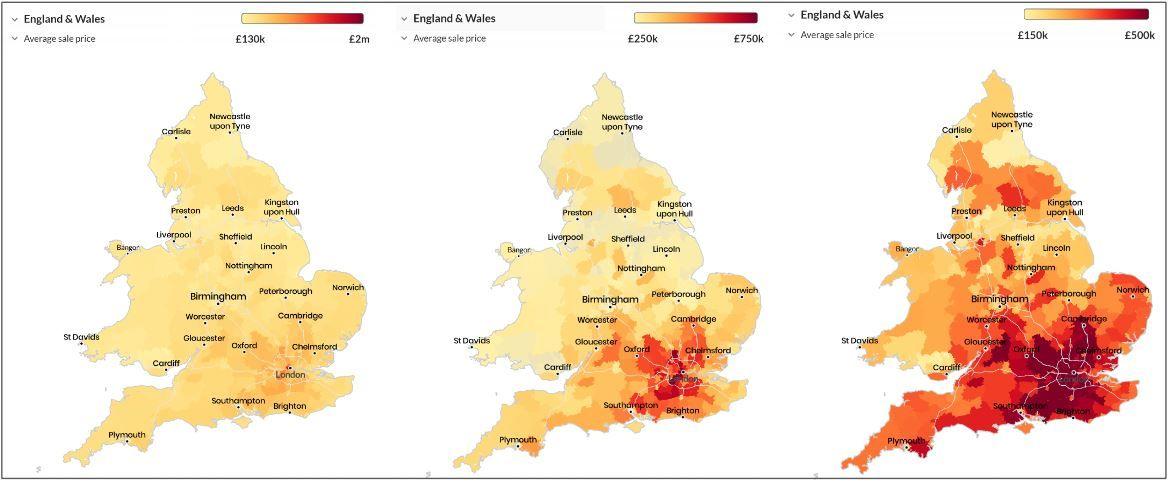
Heat maps of average house prices often display large uniform colours around the rest of the country outside of London, with distribution of values being distorted by incredibly high prices in certain areas of the capital. With the Bricks&Logic heat map, however, you can adjust the scale to obtain the desired information.
The image below illustrates the average sale price of properties with three different scales: the minimum and maximum of the areas on the left, £250k-£750k in the middle, and finally £150k-£500k. By modifying the scale to match the region being examined, we can clearly identify house price hot spots in each area. This approach provides a more accurate representation of the distribution of house prices and facilitates more informed decision-making for prospective buyers and sellers
Comprehensive property search and visualisation
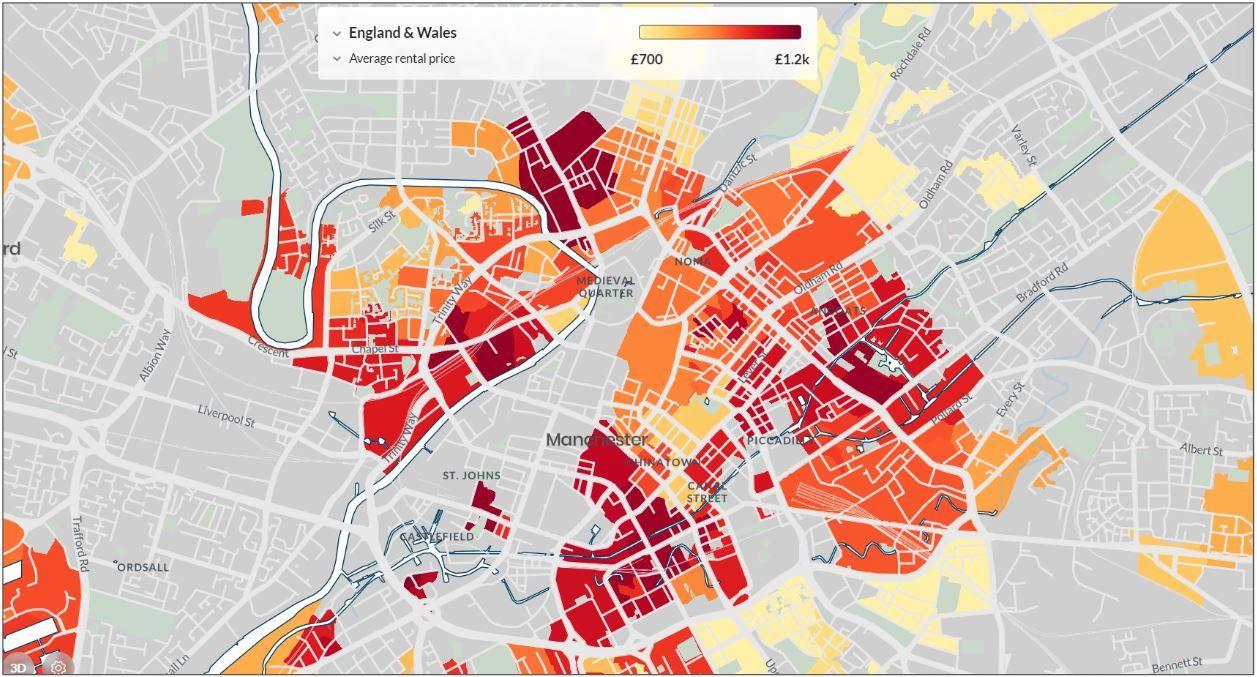
At Bricks&Logic, we offer the ability to search every property in England and Wales, not just those available for sale or rent. For instance, if you are planning to move to Manchester and want to find a good area to rent, you can use our platform to set up filters based on your requirements. You can then narrow down your rental search and even share your details with our partner Estate Agents in the area to help you find the right property.
For example, let’s consider the average rental price for flats with specific filters in place:
- Modern build
- At least 2 bedrooms and 750 sq ft of space
- Includes some form of outdoor area
- Maximum rental value of £1200 per calendar month
Our heatmap then provides a quick visualisation of the availability of these types of properties (grey areas indicate a lack of properties matching your filter) and their relative cost across different areas. This approach streamlines the search process and enhances the decision-making capabilities of buyers and renters.
How do we know what is happening in an area if very little has sold?
In today’s world, companies are eager to showcase how they are incorporating Machine Learning, Big Data, and Artificial Intelligence (AI) in their operations. However, these buzzwords and techniques can often be confusing for people. At Bricks&Logic we aim to be transparent with our approach to using these technologies to make them more accessible and trusted in a world where they are not commonly used.
If you would like a more in-depth description of this process then please read this detailed blog on our approach to creating property level indices. However, a short overview of the steps are:
- Understand the nature of every property.
- Examine the trends in price movements for different types of properties and locations.
- Analyze the location and type of each property and consider all relevant information to make an informed decision about its price movement.
- Aggregate the movements of all properties in a given location.
For instance, if we were analyzing a mid-century flat with a garden in Norwich, we would examine property prices in Norwich, the demand for flats over time in Norwich and surrounding areas, and trends for properties with gardens both locally and nationally. By combining all of this information, we can make a decision about how the price is moving for that specific property.
How up to date is the data?
One of the questions we are frequently asked is, “How up-to-date is your data?” This query often arises due to the well-known fact that sale prices in the Land Registry are often delayed by months. However, we are fortunate to have access to a comprehensive dataset from our Estate Agent partners that enables us to keep our finger on the pulse of the property market as much as possible. For instance, in our January market update, you can observe how we captured the declining market following the infamous “mini budget” well before these prices appeared in the Land Registry index.
A game changer for the property market
Until now communicating what is happening in the market has been a very confusing process. Currently visual representations of the property market are usually limited by:
- Time lag between property sale and registration with Land Registry can result in outdated data
- Lack of detail in Land Registry data (only sale price recorded, not property condition or features) can limit accuracy, particularly in areas with diverse property types or varying levels of refurbishment
- Limited number of property sales in some areas can make it challenging to create accurate heat maps with sufficient granularity
The Bricks&Logic heat map solves all of these problems meaning communicating and understanding the market has never been easier’
Not one to pull punches Michael concludes that, “At Bricks&Logic we have created possibly the UK’s most accurate and interactive house price heat map by utilising advanced statistical techniques and big data.
“This heat map offers a more granular and detailed view of the property market compared to traditional approaches, providing users with the ability to explore various features such as sale, rental, and yield values, visualisations of sale and rental value movements over time, and filtering by unique attributes.
“The Bricks&Logic heat map can adapt to accurately portray house prices and offers comprehensive property search and visualisation. By solving the problems of outdated data, lack of detail, and limited sales, our house price heat map is a game-changer in the property market. It provides a transparent and accessible tool for both the general public and professionals to make informed decisions based on the latest data.”
About Bricks&Logic

If you would like to find out more about the Bricks&Logic Heat Map or how else Bricks&Logic could help your business please book a demo by simply contacting a very busy Chief Data Scientist Michael Joyner, at michael@bricksandlogic.com
Proptech and Property News in association with Estate Agent Networking.

Andrew Stanton is the founder and CEO of Proptech-PR, a consultancy for Founders of Proptechs looking to grow and exit, using his influence from decades of industry experience. Separately he is a consultant to some of the biggest names in global real estate, advising on sales and acquisitions, market positioning, and operations. He is also the founder and editor of Proptech-X Proptech & Property News, where his insights, connections and detailed analysis and commentary on proptech and real estate are second to none.
-
Andrew Stantonhttps://proptech-x.com/author/andrew-stanton/

-
Andrew Stantonhttps://proptech-x.com/author/andrew-stanton/

-
Andrew Stantonhttps://proptech-x.com/author/andrew-stanton/

-
Andrew Stantonhttps://proptech-x.com/author/andrew-stanton/